Parcel boundary labeling from satellite imagery
Parcel boundary labeling draws one closed polygon around every agricultural field in a satellite image. The result is the field map that crop-type, yield and subsidy models work on, and the training data for models that delineate fields automatically.
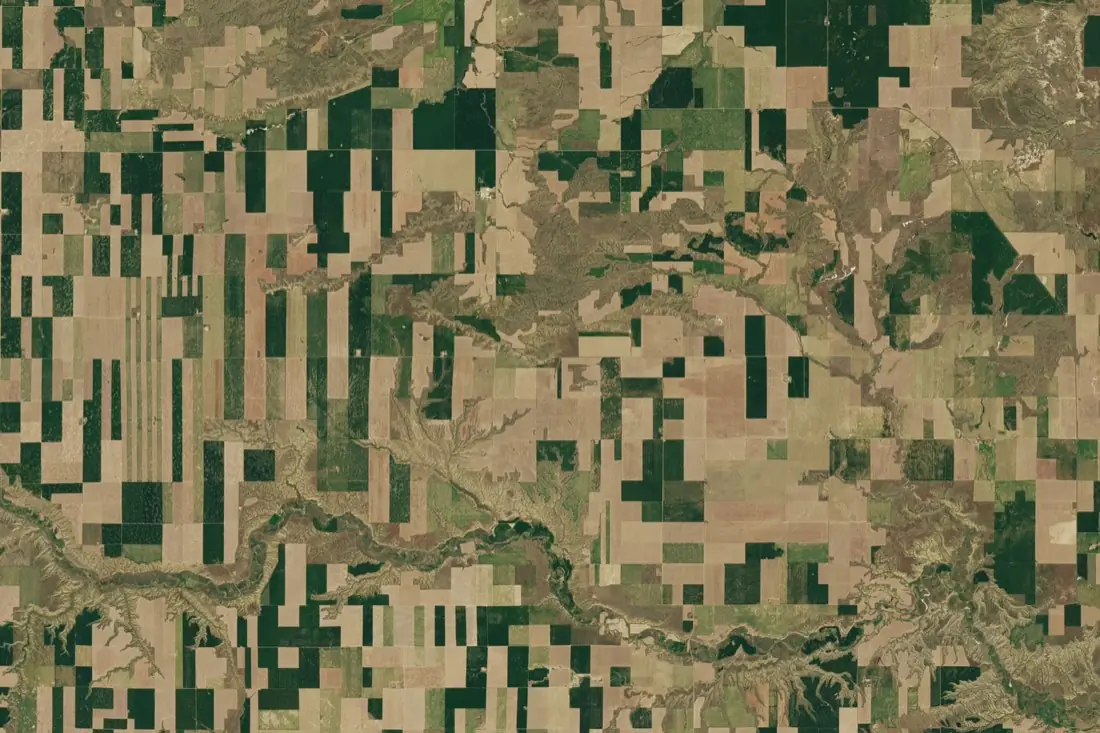
- Cropped parcel24 polygons
What parcel boundaries labeling is
Most agricultural analytics start with a field. Crop type, yield, stress and harvest are all reported per parcel, so the boundaries come first. Land registries are often outdated, and fields change from year to year as they are merged, split or rotated, so the boundaries need to come from recent imagery. We trace each visible field edge (tracks, hedgerows, fences, changes in crop) and keep shared edges between neighbouring parcels topologically clean, with no gaps or overlaps.
How we label it
We label on a cloud-free scene from the growing season, checked against a second date when an edge is unclear. Parcels share vertices along common borders, slivers below your minimum mapping unit are merged, and non-field land (farmyards, drainage, woodland strips) is left out or labeled as its own class.
Who uses parcel boundaries labels
Field delineation models
Ground-truth polygons to train and validate models that segment fields automatically across a region or a country.
Subsidy and CAP checks
A current field layer to compare against declared parcels in area-monitoring workflows.
Farm management software
Draw-free onboarding: farmers pick their fields instead of digitising them by hand.
Yield and crop statistics
The unit that every per-field statistic (area, crop, yield) is aggregated to.
How a project runs
Four steps, each ending in something you can check before the next one starts.
Brief
Area, dates and class list agreed in writing, with example images for every class and its edge cases.
You getWritten labeling guideline
Imagery
Your imagery, or sourced for you: free Sentinel and Landsat, or commercial high-resolution scenes.
You getScene list with dates and resolution
Labeling
Annotators work to the guideline. Anything the imagery cannot settle is flagged, not guessed.
You getLabels plus a log of flagged cases
Check & delivery
Every class is reviewed against a sample before the data leaves us.
You getData and per-class accuracy, in your format and CRS
Questions about parcel boundaries
What resolution do I need for field boundaries?
For large arable fields, Sentinel-2 at 10 m works well and is free. For small or narrow parcels, common in parts of Europe and Asia, sub-metre imagery is needed to see the edges reliably.
Can you label boundaries that are not visible in one image?
Often yes. We compare a second date from the season: two fields with the same crop on one date usually differ on another.
How are shared edges handled?
Neighbouring parcels share the same vertices, so the layer has no gaps or overlaps and can be used directly as a field map.
Related label types
Need parcel boundaries labeled?
Tell us your area, your imagery and what your model has to learn. We reply with a proposed class list and a quote.