Crop stress labeling from multispectral imagery
Crop stress labeling marks which fields, or which parts of a field, are healthy and which are under stress from drought, disease, pests or poor nutrition. Models trained on it flag problems weeks before they show up in yield.
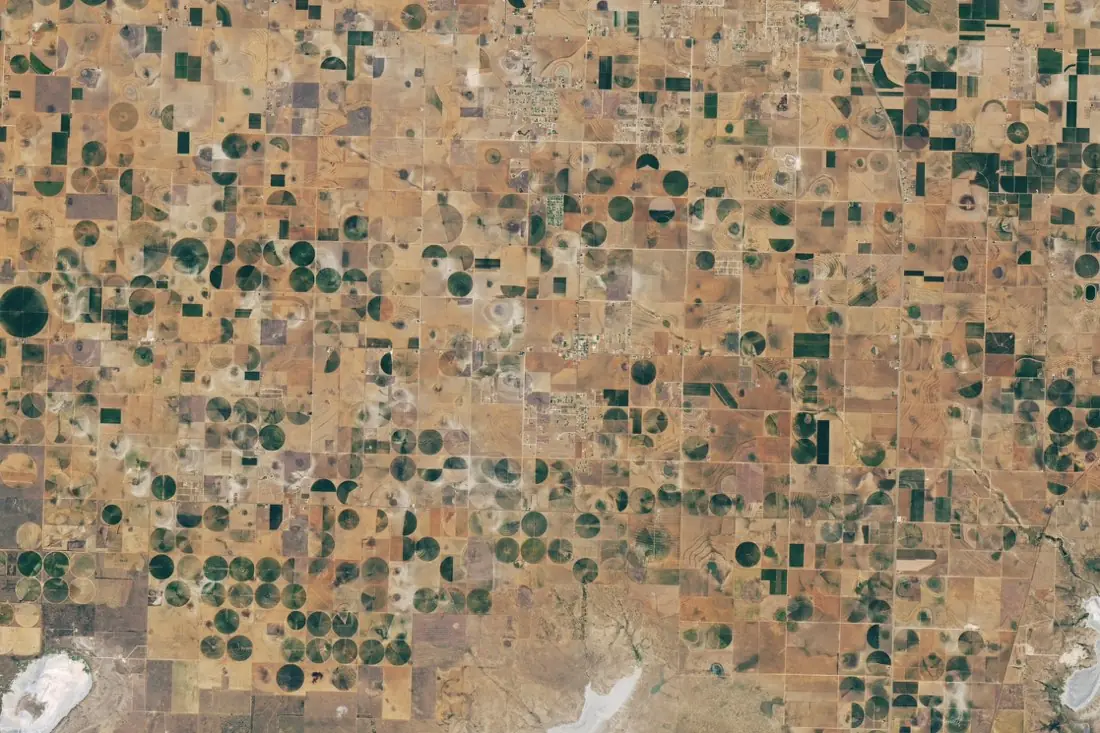
- Healthy (irrigated)21 circles
- Stressed12 circles
- Dry playa2 polygons
What crop stress labeling is
Stressed vegetation reflects light differently, especially in the red-edge and near-infrared bands that Sentinel-2 and Landsat record. We label stress from the imagery and its vegetation indices, compared against the field’s own history and its neighbours, so a naturally sparse crop is not mistaken for a failing one. The image here shows irrigated fields during a Texas drought: dark green pivots are still growing, pale ones show stress or have been left fallow.
How we label it
Classes are defined with you (for example healthy, moderate stress, severe stress, failed) and pinned to index thresholds and visual examples in the guideline. We label at field or zone level and record the date, because stress is a moment in time, not a permanent property.
Who uses crop stress labels
Crop-health monitoring
Training data for alerts that send agronomists to the right field at the right time.
Irrigation management
Find under-watered zones and broken pivots across thousands of fields.
Drought and yield insurance
Evidence of crop condition through the season to support index and claims models.
Commodity forecasting
Track crop condition across a growing region before official estimates.
How a project runs
Four steps, each ending in something you can check before the next one starts.
Brief
Area, dates and class list agreed in writing, with example images for every class and its edge cases.
You getWritten labeling guideline
Imagery
Your imagery, or sourced for you: free Sentinel and Landsat, or commercial high-resolution scenes.
You getScene list with dates and resolution
Labeling
Annotators work to the guideline. Anything the imagery cannot settle is flagged, not guessed.
You getLabels plus a log of flagged cases
Check & delivery
Every class is reviewed against a sample before the data leaves us.
You getData and per-class accuracy, in your format and CRS
Questions about crop stress
Can satellite imagery tell drought from disease?
Sometimes, from the pattern: drought follows soils and irrigation, disease often spreads from a point. When the cause cannot be seen, we label the stress and leave the cause empty.
Which index do you use?
Whichever fits the crop and sensor (NDVI, NDRE or others), always checked against the true-colour image so index artefacts are not labeled as stress.
How often can stress be labeled?
As often as there is a clear image: every few days with Sentinel-2 when the sky allows.
Related label types
Need crop stress labeled?
Tell us your area, your imagery and what your model has to learn. We reply with a proposed class list and a quote.