Building damage labeling after disasters
Building damage labeling grades each building in post-disaster imagery (typically intact, damaged or destroyed) and marks debris fields. It is the ground truth for automated damage assessment and a fast first view for claims teams.
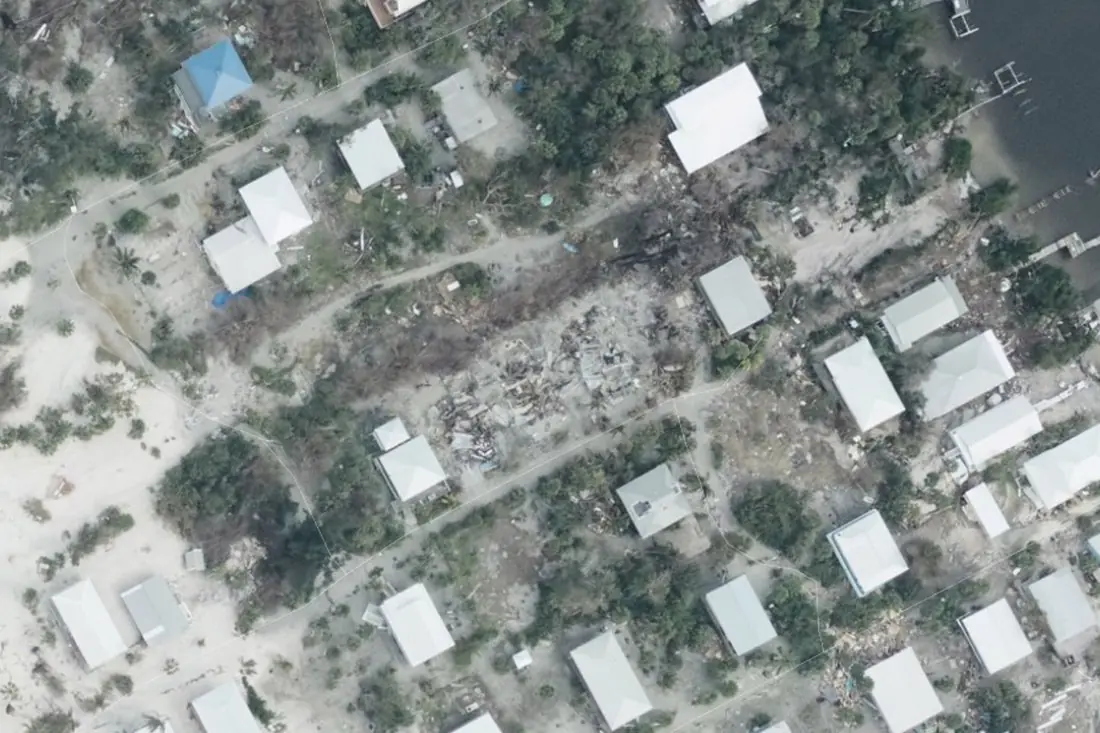
- Intact25 boxes
- Destroyed1 polygon
- Debris field2 polygons
What building damage labeling is
Damage is visible only at high resolution: roofs torn off, walls collapsed, debris spread across plots. We label on aerial or sub-metre satellite imagery after the event, compared to a pre-event image where one exists, so a building that was never there is not counted as destroyed. The example is aerial imagery from the Florida coast after Hurricane Milton.
How we label it
Each building gets a footprint or point and a grade on a written scale: ours, or a standard scale such as the one used in the xBD dataset. Uncertain cases (heavy tree cover, shadow) are flagged, not guessed.
Who uses building damage labels
Claims triage
Grade thousands of buildings in hours so adjusters go first where damage is worst.
Damage assessment models
Graded examples to train models for the next hurricane, earthquake or flood.
Catastrophe model validation
Compare modelled damage with what actually happened, building by building.
Relief and recovery
Counts of destroyed and damaged homes per area for response planning.
How a project runs
Four steps, each ending in something you can check before the next one starts.
Brief
Area, dates and class list agreed in writing, with example images for every class and its edge cases.
You getWritten labeling guideline
Imagery
Your imagery, or sourced for you: free Sentinel and Landsat, or commercial high-resolution scenes.
You getScene list with dates and resolution
Labeling
Annotators work to the guideline. Anything the imagery cannot settle is flagged, not guessed.
You getLabels plus a log of flagged cases
Check & delivery
Every class is reviewed against a sample before the data leaves us.
You getData and per-class accuracy, in your format and CRS
Questions about building damage
Can you assess damage from Sentinel-2?
Not per building: at 10 m a house is one pixel. Sentinel data shows flood and burn extent; damage to buildings needs aerial or sub-metre imagery.
Do you need a pre-event image?
It is strongly recommended. Without one, a cleared plot and a destroyed house can look the same.
Which damage scale do you use?
Yours if you have one. Otherwise a four-level scale from intact to destroyed, defined with visual examples in the guideline.
Related label types
Need building damage labeled?
Tell us your area, your imagery and what your model has to learn. We reply with a proposed class list and a quote.